For capacity management, Hayei has a particular data source type called Prometheus. It is important to have a Prometheus installation monitoring the system. By default, Ormuco Stack monitors basic metrics per data center.
To set up a Prometheus Data Source, Ormuco will provide you with all the information needed to do it. Then, you can apply the below instructions to connect to Ormuco’s Centralized Prometheus or any other Prometheus installation.
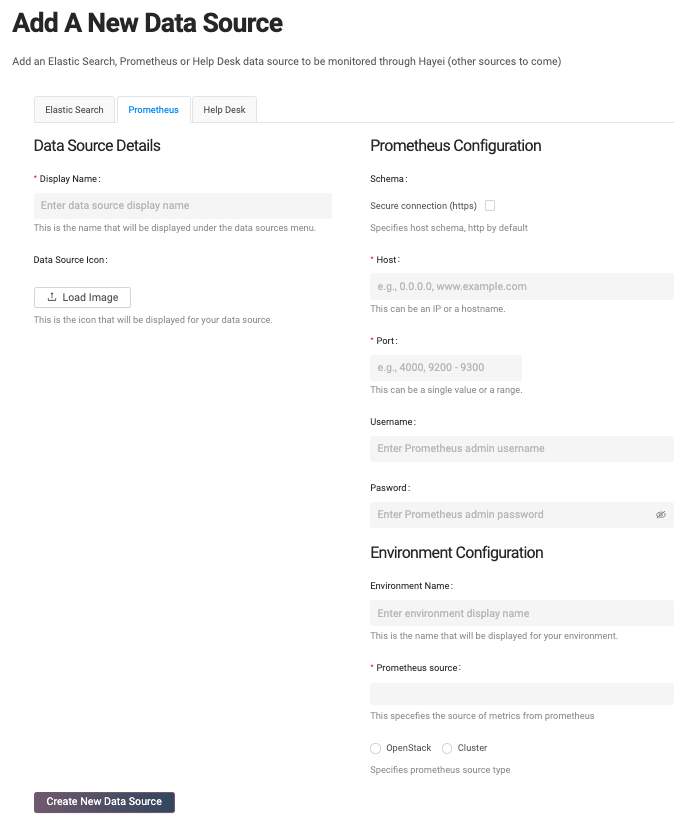
The first step is to define a name for the data source. Then, optionally, you can load an image (the image must be a square figure).
Depending on the Prometheus installation, the user should choose the schema between [“http” or “https”]. Then type the host and the port and the Prometheus credentials (user and password).
The final step is to set up an environment. A Prometheus installation can monitor multiple environments. Each environment has a unique index that is known as the Prometheus source. Internally, Prometheus can monitor the data center under the OpenStack type and monitor a Kubernetes Cluster (DeOS).