It is the most relevant view. It shows average values for different metrics and plots the behavior over time.

Global Metrics
The default view for a Kubernetes cluster displays global cluster metrics. By default, the values are the average of the last 12 hours, and they are updated each minute.

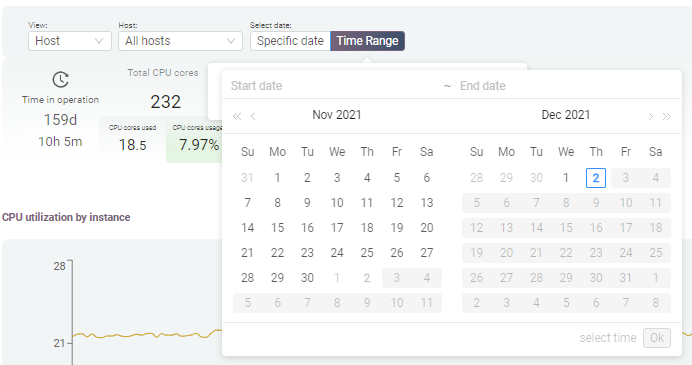
Select date
It is possible to choose a time range (between dates). This option affects the global values (shown on top) and the metrics displayed below.
As an extra feature, Hayei can display metrics for a specific date. For example, the system would calculate the average from 00:00:00 to 23:59:59 of the picked date.
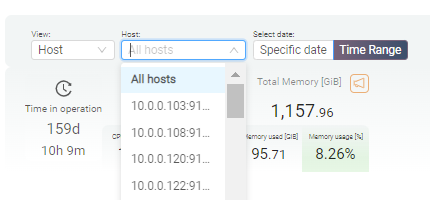
View by Host
Hayei also can desegregate the metrics per host. With this option, anyone can better understand what is happening (or being used) on each host.
Choose between Host and Apps
For a Kubernetes cluster, Hayei can show metrics related to applications.
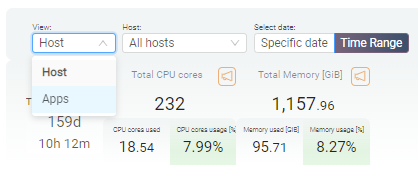
View by Apps
Hayei can also display metrics by application.

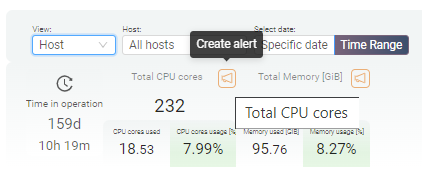
Create Alerts
It is possible to create alerts for specific metrics by clicking on the megaphone icon.
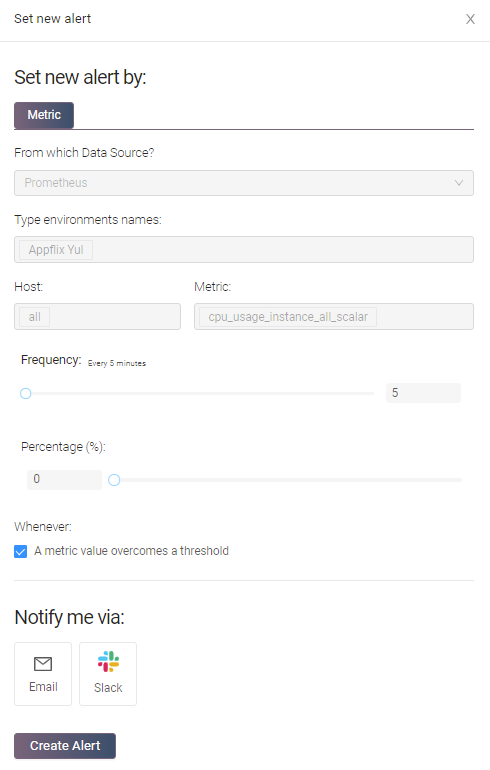
To make the creation of an alert easy, Hayei only requires a few fields. The frequency indicates how frequently Hayei notifies the receiver and avoids too many alert emails. The percentage is the threshold or set point that triggers the notification. Once the current value exceeds the threshold, Hayei would send an email (or Slack message) based on the frequency value. When the alert condition disappears, Hayei sends a notification for that. The last field is the email address (or the slack channel) for the receiver.
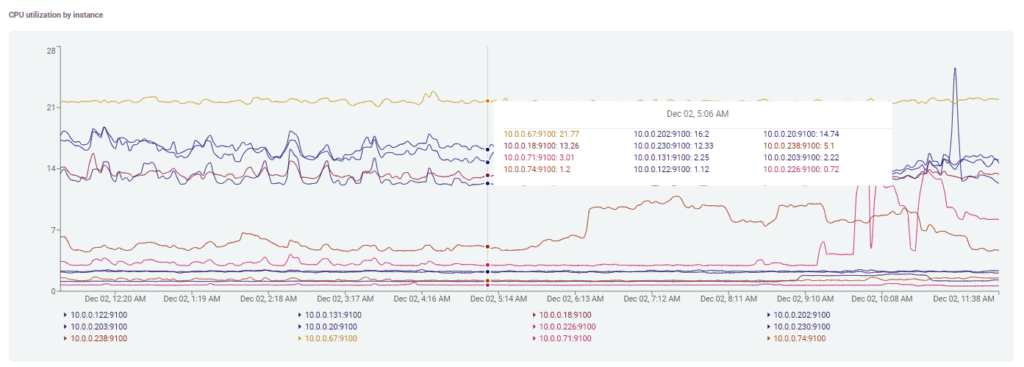
Metric Plots
The most visible part of the metrics is the historical values. By default, Hayei shows the last 12 hours. However, the information gets updated every minute depending on the select values for View, Host, and Select date. The cursor highlights the instantaneous values.