It is the most relevant view. It shows average values for different metrics and plots the behavior over time.
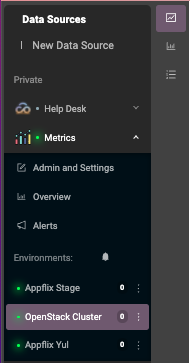
Global Metrics
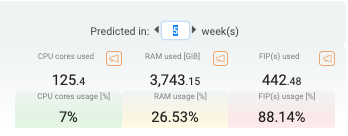
The default view for an OpenStack Cluster displays metrics for all servers. In this view, Hayei shows the CPU, the RAM Memory, and the Floating IP of the cluster. It also forecasts the usage of those metrics. By default, the metric values for CPU, RAM, and FIP are the average of the last 12 hours. The predictions are the values estimated for four weeks ahead. Both tables are updated each minute.

Hayei can display metrics for a specific date. For example, the system would calculate the average from 00:00:00 to 23:59:59 of the picked date. It is also possible to choose a time range (between dates). This option affects the global values (shown on top) and the metrics displayed below.

View by Server
Hayei also can desegregate the metrics per server. With this option, anyone can better understand what is happening (or being used) on each compute or controller server.

Choose between Server and Storage
For an OpenStack Cluster, Hayei can show metrics related to compute or controller server and storage serves.

View by Storage
Hayei can also display metrics by a specific storage server.

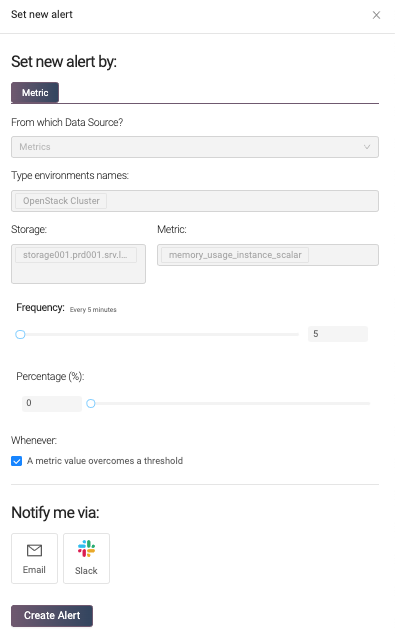
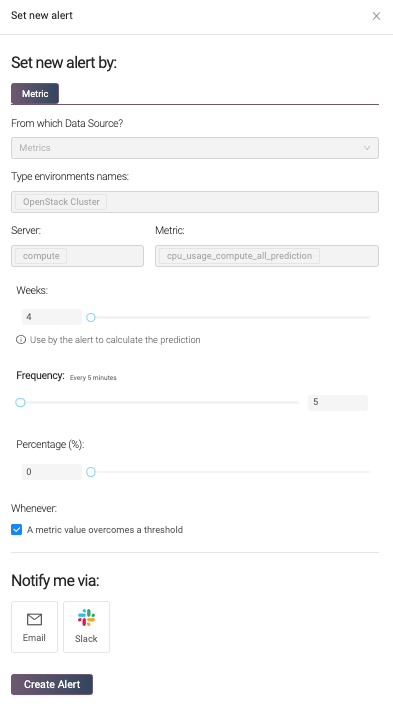
Create Alerts for Metrics
It is possible to create alerts for specific metrics by clicking on the megaphone icon.

To make the creation of an alert easy, Hayei only requires a few fields. The frequency indicates how frequently Hayei notifies the receiver and avoids too many alert emails. The percentage is the threshold or set point that triggers the notification. Once the current value exceeds the threshold, Hayei would send an email (or Slack message) based on the frequency value. When the alert condition disappears, Hayei sends a notification for that. The last field is the email address (or the slack channel) for the receiver.
Create Alerts for Predictions
For the prediction section, Hayei can predict the usage amount (CPU, RAM, or FIP) several weeks ahead, a maximum of 99 weeks (around two years). However, it is worth mentioning that the forecasting becomes more precise when more data is available in the Prometheus Database. Hayei needs a range of measurement data equivalent to 20% interpolation time to provide better predictions, so 1w of history to predict behavior 5w.
As in the metrics, Hayei can alert based on a prediction. For example, this feature might help anticipate the lack of a resource shortly based on the current cluster behavior.
Before setting an alert, check the retention policy that applies to Prometheus installation to guarantee enough historical data for the prediction (rule of thumb 1 to 5).
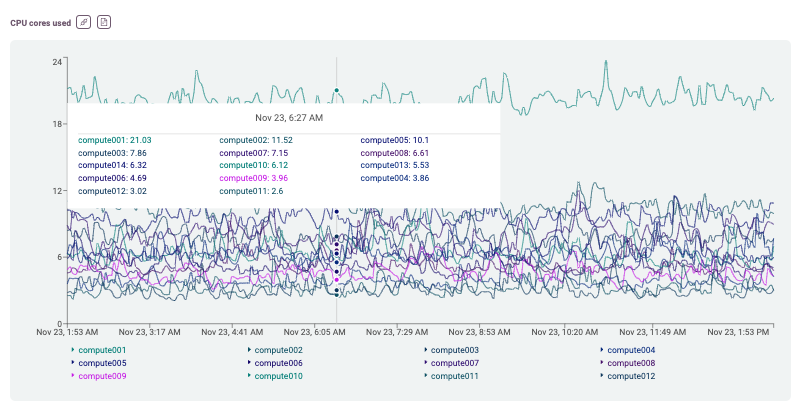
Metric Plots
The most visible part of the metrics is the historical values. By default, Hayei shows the last 12 hours. However, the information gets updated every minute depending on the select values for View, Host, and Select date. The cursor highlights the instantaneous values.
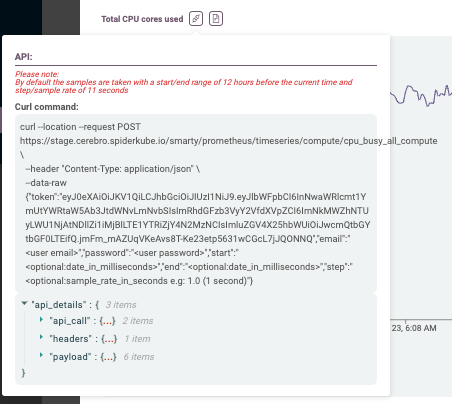
API for Metrics
For OpenStack environments, Hayei allows you to get the metrics through an API.

Hayei shows an example of how to use it as a curl command. For security reasons, a user must provide their email address and password. Optionally, users can choose from where to where to get metrics as well as the sample rate. The API accepts dates in milliseconds (a.k.a. epochs). For sample rates, the API allows users to choose values in seconds. For example, the small value can be 0.1 (100 milliseconds).
Note: Hayei provides a proxy to get metrics from Prometheus. As a result, the API only returns a maximum of 11,000 values per time series. If the request might return more than the maximum value, the user will get an error. The user can reduce the time window (star-to-end) or increase the sample rate to work around this.
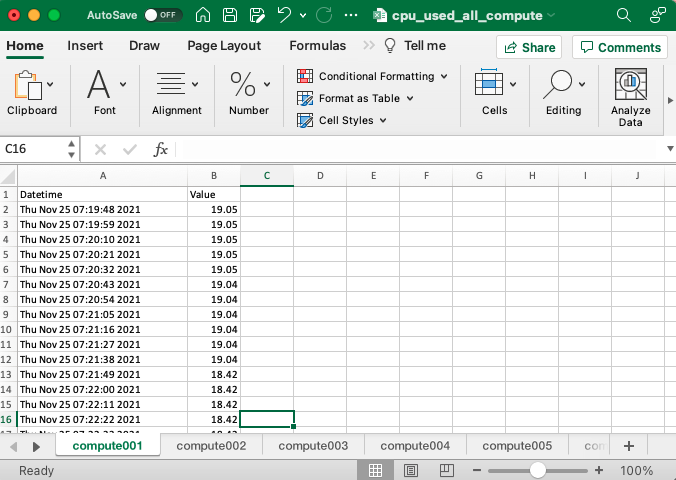
Metrics Report
In addition, Hayei allows you to download the metrics in an Excel file.
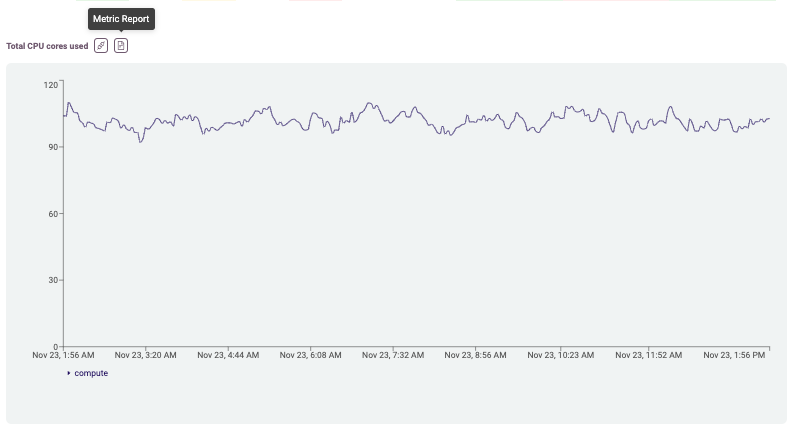
Like the API, a user can choose the sample rate and time range or specific date for metrics.
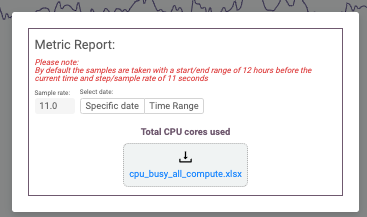
Files that collect several servers display each server in a tab.