The next menu is Overview. This section provides insights of the environments under monitoring.
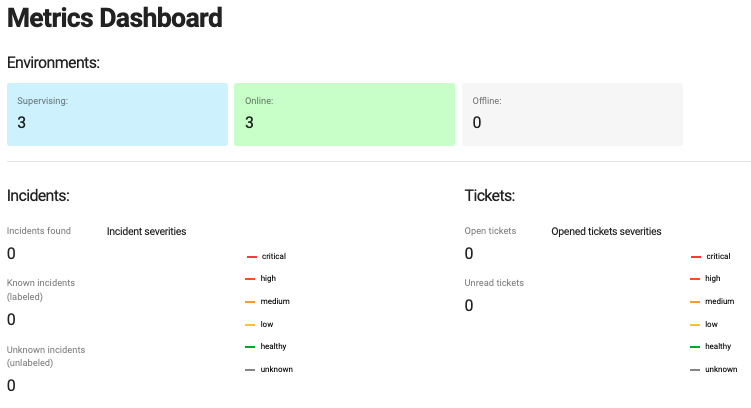
In one view, Hayei tells us how many environments are online and how many incidents are open and unread in the Data Source. It also shows the severity of the incident in a pie diagram.
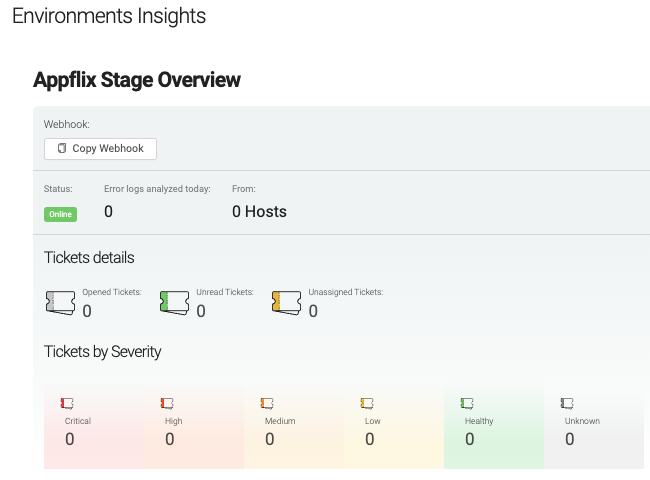
Hayei also displays detailed information per environment. Hayei has the capability to receive alerts from AlertManager. Alertmanager handles alerts sent by client applications such as the Prometheus server. It takes care of deduplicating, grouping, and routing them to Hayei through a webhook. Each environment has a webhook that must be added to the AlertManager instance to be able to communicate with Hayei.
A webhook looks similar to:
https://<hayei_url>/smarty/prometheus/<datasource_uuid>/<environment_id>/ticket
For more details:
https://prometheus.io/docs/alerting/latest/configuration/#webhook_config